Five Analytics tabs: Overview, Trends, Sources, Themes, and Insights

The Analytics page is now organized around five tabs, each built around the kind of question you'd otherwise have to construct by hand.
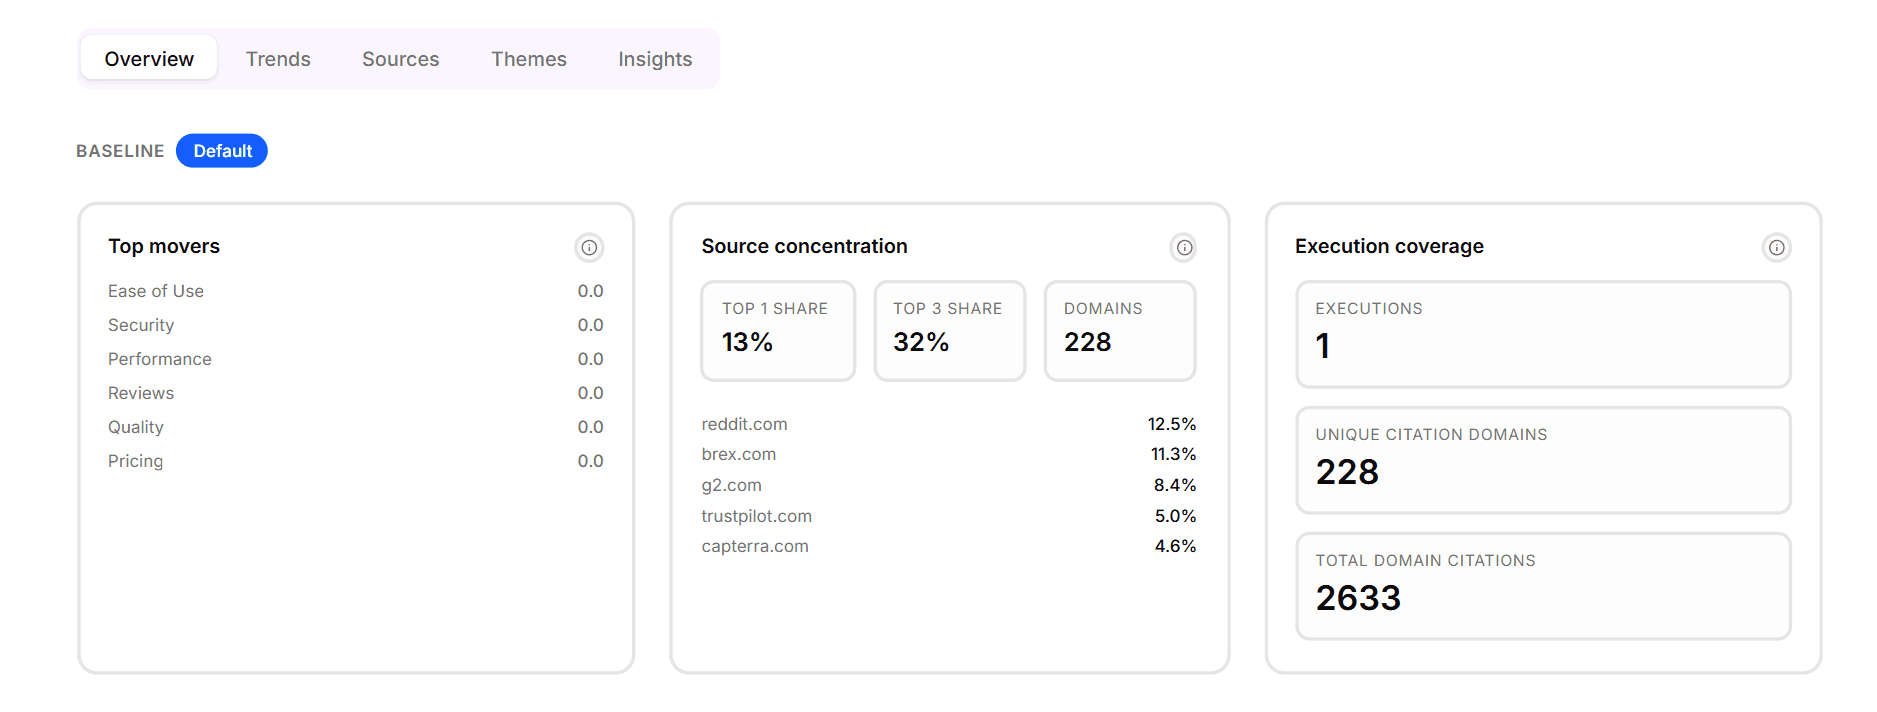
Overview
The default view. Top movers, source concentration, execution coverage, and the per-category performance table. Designed to answer "where are we right now?" in under 30 seconds.
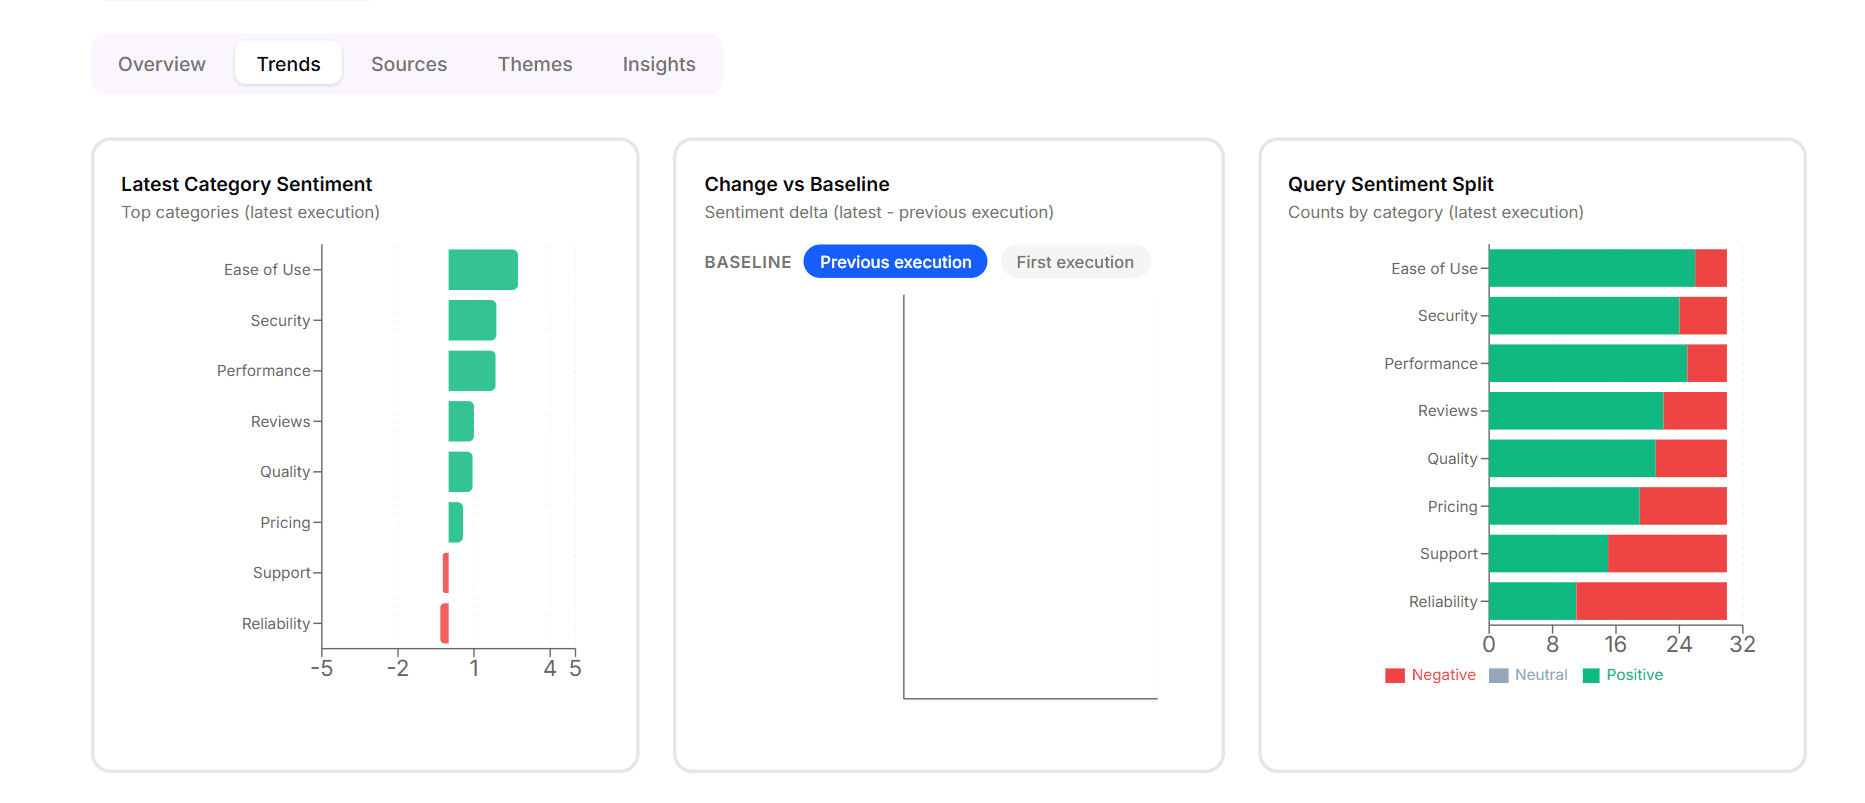
Trends
Time-series views of every KPI on the page — mean sentiment over time, share-of-voice over time, citation count over time. Each line tied to your execution history so you can see what changed and roughly when. Best read after you've scheduled an Experiment on a weekly or monthly cadence.
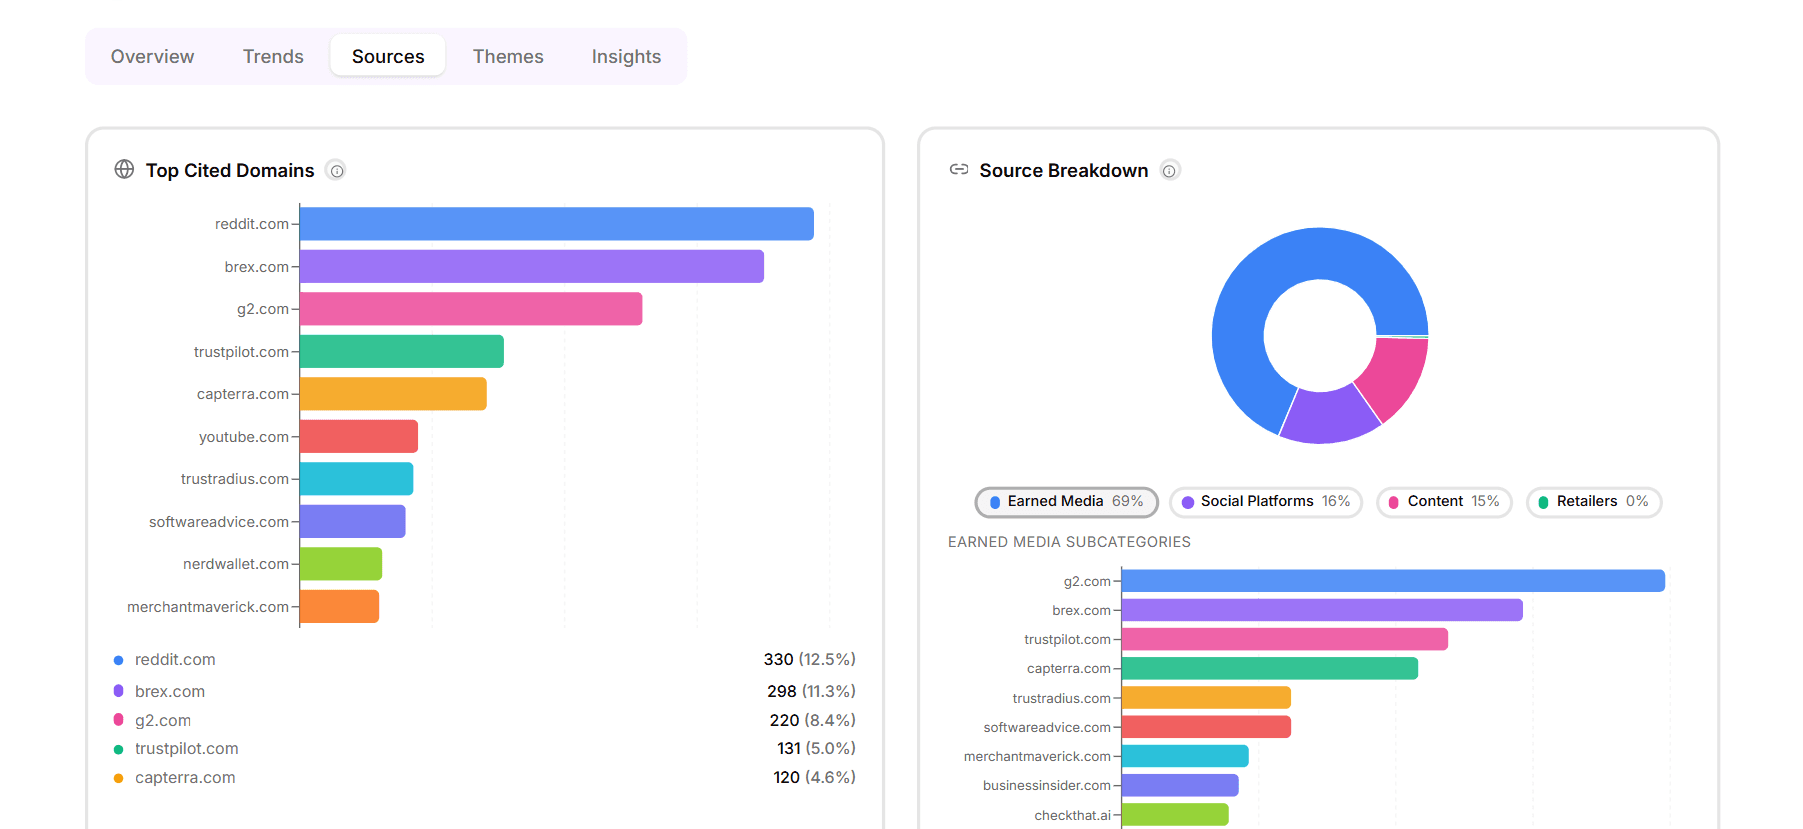
Sources
Every cited domain and URL across every result, with the Source Details treatment — URL ↔ domain toggle, source-type buckets, and per-category citation mix. The view your content team should open before deciding what to write next.
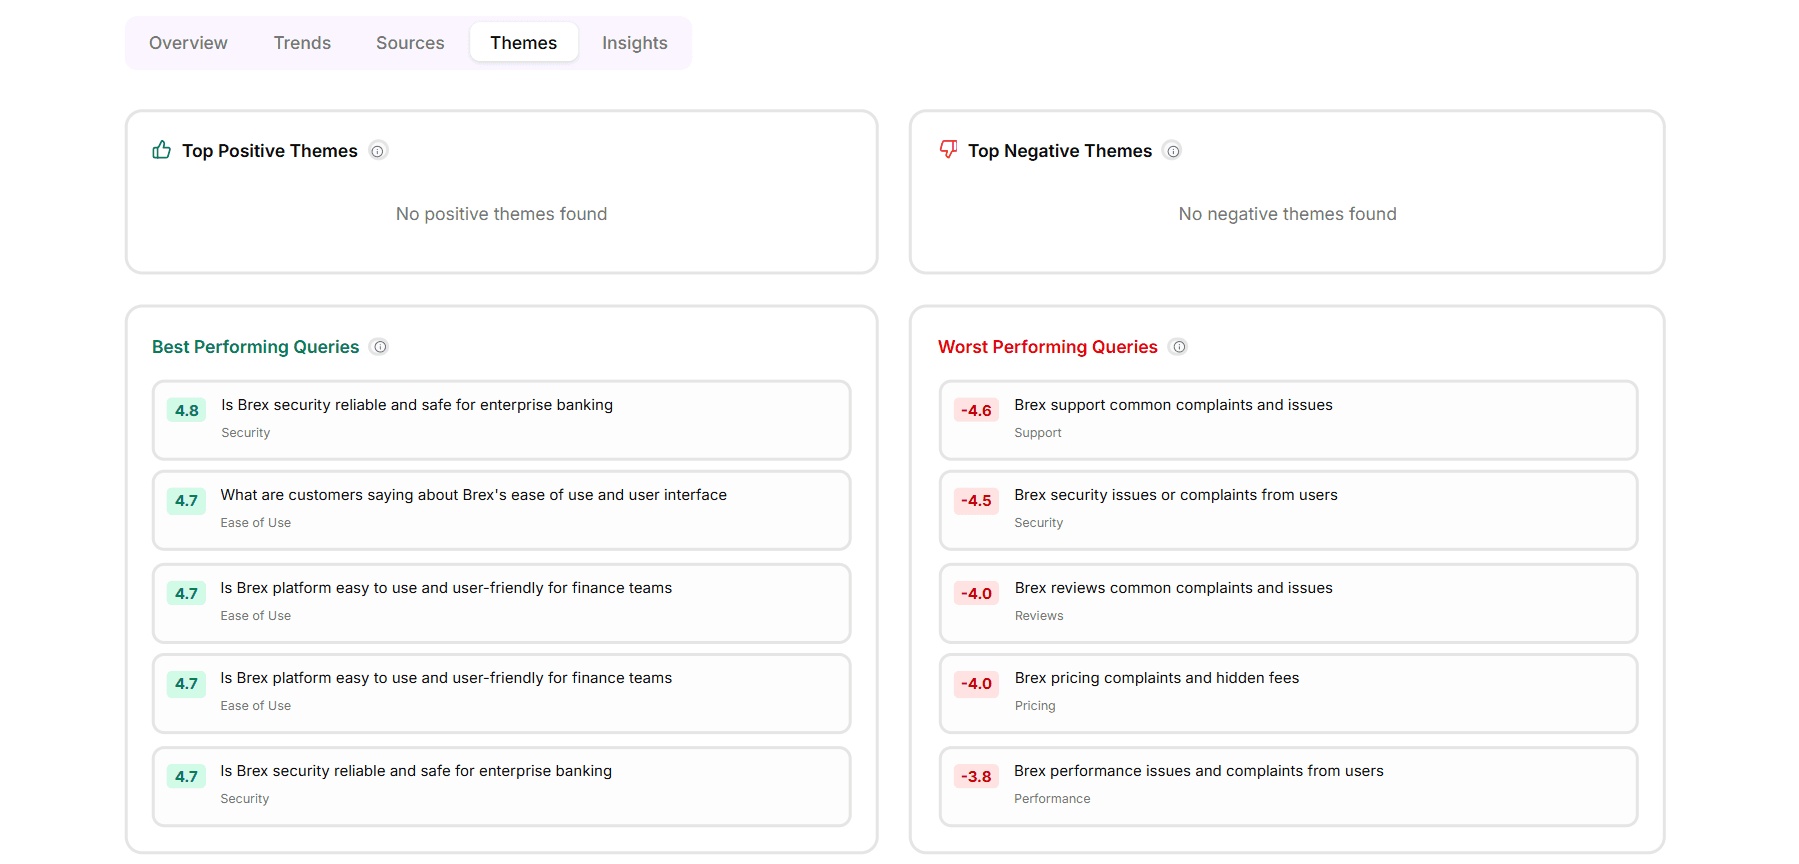
Themes
The recurring themes and topics that show up in LLM responses about your brand and competitors. Pulled from the response text rather than just the brand-mention layer. Useful when you want to know not just that you're cited, but for what.
Insights
The auto-generated read of what changed since last execution — share-of-voice shifts above threshold, sentiment swings, new domains rising on the leaderboard, categories where you've gained or lost coverage. The 60-second briefing version of every other tab.
Available today
All five tabs are live in Reporting → Analytics. The tabs persist their selected state across executions, so if you always open to Trends you'll keep landing on Trends until you switch.
